
Tampilkan postingan dengan label Artikel Bahasa Inggris. Tampilkan semua postingan
Tampilkan postingan dengan label Artikel Bahasa Inggris. Tampilkan semua postingan
How S-DES Works
Abstract
Data Encryption Standard (DES) is one of the most widely used symmetric key cryptography algorithm. Therefore, the susceptibility of DES to different kind of attacks has been a concern since the algorithm was first made public. The problem has escalated to the point that Electronic Frontier Foundation has now built a DES cracking machine, at a cost of less than 250,000 USD, that can find the right key in about three days. Of course, the cryptanalytic technique used to find this key might seem overwhelming for us as students to learn. Hence, we need a simpler version of DES in order to learn about these cryptanalytic techniques, S-DES is the answer. S-DES is simpler version of DES that operates on 8-bit message blocks and 10-bits key. This paper discuss about S-DES design, how S-DES works, and different kind of attacks on S-DES.
Introduction
S-DES is a simpler version of the DES algorithm. S-DES operates on 8-bit message blocks and 10- bits key. It was designed as a test block cipher for learning about modern cryptanalytic techniques such as linear cryptanalysis, differential cryptanalysis, and linear-differential cryptanalysis. The same key is used for encryption and decryption. With its 10-bits key, comparing to 56-bits key used by DES, S-DES is much more vulnerable to an attack. Different kind of attacks that have been proven successful to reveal S-DES key or subset of key are brute force attack, chosen plain text attack, chosen cipher text attack, and known plain text attack.
S-DES
S-DES operates on 8-bit message blocks and 10-bits key. It consists of three steps: initial permutation, two rounds key-dependent computation, and inverse of initial permutation. The 10-bit key is used to generate two different blocks of 8-bit sub keys. The first block is used in the first round of key-dependent permutation and the second block is used in the second round. First, the 10-bit key is subject to an initial permutation, Permuted Choice 1 which is determined by table PC-1, to generate two 5-bit blocks named A0 and B0.
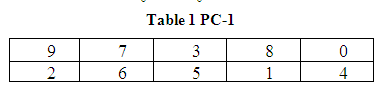 There are two rows in the table. The first row determines the bits of A0 and the second row determines the bits of B0. Thus, the bits of A0 are bits 9, 7, 3, 8, 0 of 10 -bit key and the bits of B0 are bits 2, 6, 5, 1, 4 of 10-bit key. Second, a single left shift is performed on A0 and B0yielding A1 and B1. Third, B1 is concatenated to A1 and then subjected to the second permutation, Permuted Choice 2 which is determined by table PC-2, to form the first block of 8-bit sub keys named K1.
 Thus, the bits of K1 are bits 3, 1, 7, 5, 0, 6, 4, and 2 of bits of A1B1. Fourth, a two left shifts is performed on A1 and B1 yielding A2and B2. Fifth, B2 is concatenated to A2 and then subjected to the second permutation, Permuted Choice 2, to form the second block of 8-bit sub keys named K2.


Figure 1 S-DES Key Generation
The encryption procedure can be summarized as:
 Where,
C : cipher text
P : plain text
K : 10-bit key
IP : initial permutation
IP-1 : inverse of initial permutation
ρ1 : first round of key dependent
Computation
ρ2 : second round of key dependent
Computation
First, the 8-bit message block is subjected to an initial permutation, IP, which is determined by table IP, to generate two 4-bit blocks named L0 and R0.
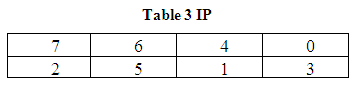

There are two rows in the table. The first row determines the bits of L0 and the second row determines the bits of R0. Thus, the bits of L 0 are bits 7, 6, 4, 0 of 8-bit message block and the bits of R0 are bits 2, 5, 1, 3 of 8-bit message block. Second, L0 and R0 are subjected to first round of key dependent computation yielding L1 and R1, which can be summarized as follows:

where,
f : key dependent cipher function (will be explained bellow)
Third, L1 and R1are subjected to second round of key dependent computation yielding L2and R2, which can be summarized as follows:

Fourth, R2 is concatenated to L2 and then subjected to the second permutation, IP-1which is inverse of initial permutation. The result of this last step is ciphered 8-bit message block corresponding to the input.


Figure 2 S-DES Encryption Procedure
The first step of key dependent cipher function, f, is to pass the 4-bit block input to function E. E is a function which takes 4- bit block input and yields a 8-bit block as output according to table:

The 8-bit block then XORed with the 8- bit sub key, K1 for first round and K2 for second round. The result of this XORing operation is then split into two 4-bit blocks, the first four bits from the most significant bit being C0 and the remaining bits being C1. C0and C1 are then applied to S0 and S1respectively. S0 and S1 are S-Boxes which take in a 4-bit input and yield a 2-bit output.
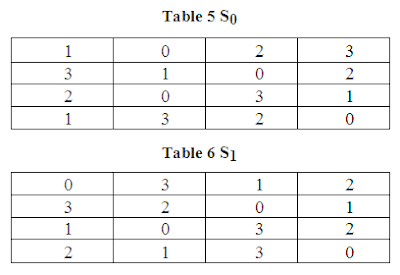

An example of how to get output using S0 and 1001 as input is as follows: we take the first bit and the last bit of 1001 and then used this result to represent a number in base 2, in which we get 3 (11 equals to 3 in base 2). 3 is the row number we are looking for. Then we take the middle two bits of 1001 and then, same as above, used this result to represent a number in base 2, in which we get 0 (00 equals to 0 in base 2). 0 is the column number we are looking for. The element of 3rd row and 0th column is 1, which in binary is written as 01. Hence, using 1001 as input, we get 01 as the output. The output of S0 and S1 are concatenated and then subjected to a permutation, P, which is determined by table P. The result of this last step becomes the result of key-dependent cipher function f.
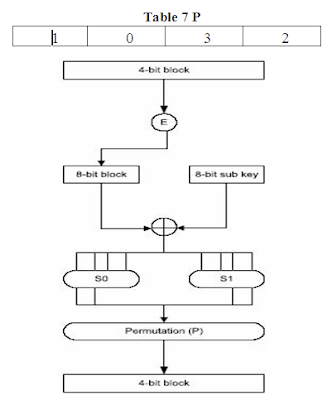

Figure 3 S-DES Key Dependent Cipher Function
The decryption procedure is the same as the encryption procedure, but the sub keys are applied in the reverse order. K2 is used in the first round and K1 is used in the second round.
Attack On S-DES
It is feasible to attack S-DES using brute force attack since it only has a key size of 10 bits. In order to perform this kind of attack, we need to have a plain text-cipher text pair in which we search the key space until the appropriate plain text encrypted with the guessed key yields the cipher text.
Differential cryptanalysis is a chosen plain text/chosen cipher text attack. Chosen plain text attack is a scenario in which the attacker has theability to chose plain text and to view their corresponding cipher text. Chosen cipher text attack is a scenario in which the attacker has ability to choose cipher text and to view their corresponding plain text. Differential cryptanalysis involves the analysis of the effect of the plain text pair difference on the resulting cipher text difference. In S-DES, the difference in a cipher text pair for a specific difference of a plain text pair is influenced by the key. By utilizing this fact, we can reveal information about the key 1).
Linear cryptanalysis is a known plain text attack.
Known plain text attack is a scenario in which the attacker has access to the pairs (Pi, Ci), i = 1, . . .N of known plain texts and their corresponding cipher texts. Linear cryptanalysis is based on the fact that there are high probability of occurrences of linear expressions consisting the plain text bits, cipher text bits, and key bits. The goal is to find the linear expression which holds with the highest linear probability bias. A linear expression consisting the plain text bits, cipher text bits, and key bits with a high linear probability bias means that the cipher used is not sufficiently random. Using the linear expression with the highest linear probability bias obtained, we can reveal information about the key 5).
Conclusion
In this paper, we have shown the design issue of S-DES and how it works in enciphering and deciphering message. With 10-bits key, different kind of attacks have been done successfully on S-DES. These including brute force attack, chosen plain text attack, chosen cipher text attack, and known plain text attack. Having this kind of characteristic, we can use S-DES as a first step in learning about cryptanalytic technique. Furthermore, this technique can also be used to attack more complicated cryptography algorithm, in this case it will be DES.
References :
- E.Biham and A.Shamir, Differential Cryptanalysis of the Data Encryption Standard, Springer-Verlag, 1993.
- Electronic Frontier Foundation, Cracking DES: Secrets of Encryption Research, Wiretap Politics, & Chip Design, O’Reilly and Associates, 1998.
- J.Killian and P.Rogaway, How to Protect DES Against Exhaustive Key Search, Advances in Cryptology-CRYPTO ’96, Lecture Notes in Computer Science, Springer-Verlag, 1996.
- K.S.Ooi and Brain Chin Vito, Cryptanalysis of S-DES, University of Sheffield Centre, Taylor’s College, 2002.
- M.Matsui, Linear Cryptanalysis Method for DES cipher, EUROCRYPT,1994.
Analysis of Pile Group under Lateral Load
Abhijit Deka
Assistant Professor, Department of Civil Engineering, Central Institute of Technology Kokrajhar, Assam, India. Email: a.deka@cit.ac.in
ABSTRACT
The pile cluster foundation may be a geotechnical composite construction, consisting of the 3 parts piles, pile cap and therefore the soil, that is applied for the inspiration of tall buildings in associate degree increasing variety. The behavior of the inspiration system is set by complicated interaction effects between the weather associate degreed an understanding of those effects is crucial for a reliable style. This study presents the 3 dimensional finite part analysis of pile cluster foundation below lateral load by exploitation ANSYS software system. The soil is sculptured to be pure clay and is assumed as undiversified and isotropic within the analysis. Elasto-Plastic behavior of the soil is numerically sculptured to follow Drucker–Prager Yield criterion. The study doesn't take into consideration the event of pore water pressure within the soil since the load applied is instant. A constant quantity study was conducted to review the behavior of pile teams below lateral load with numerous configurations. The impact of pile length, pile diameter and configuration of piles within the cluster were studied. during this study, the spacing of piles and length to diameter (L/D) magnitude relation were altered.
INTRODUCTION
Many buildings and structures need the employment of deep foundations to utilize the bearing capability of stronger soil layers. Pile teams square measure one specific variety of deep foundation unremarkably used for big structures [1-3]. additionally to vertical masses that has to be sustained by the piles, vital lateral masses is also gift and should be accounted for in style [4 -8]. These lateral masses will come back from style of sources like wind forces, collisions, wave or ice impact, earthquake shaking, phase transition and slope failure [9-10].
Investigation of nonlinear response of pile teams is a vital issue within the analysis and style of the many applied science structures like bridges, high rise buildings and towers etc. [2]. In past, several analytical/numerical ways for analysis of pile teams have utilized simplified assumptions like replacement the soil medium by Winkler springs, treating the soil medium as associate degree elastic time [11-12], and neglecting the interaction between numerous elements (namely, the pile-cap, the piles and therefore the soil medium).
The present study was directed at understanding the response of heaped-up cluster foundation subjected to lateral masses in clay soil. The analyses were performed to review the impact of pile length and pile diameter on the lateral load carrying capability of the pile cluster with increasing spacing between the piles. The impact of pile cluster configuration was additionally studied here.
MODEL DESCRIPTION, MATERIAL PROPERTIES AND BOUNDARY CONDITIONS
A three dimensional model of pile and soil was used for this study as shown in Fig. 1. The soil was sculptured to be pure clay and was assumed as undiversified and isotropic within the analysis. Elasto-Plastic behavior of the soil was accustomed follow Drucker-Prager Yield criterion. The study didn't take into consideration the event of pore water pressure within the soil since the load applied was instant.

Soil was initial discretized 2-dimensionally by four noded plane eighty two solid parts, that was later extruded with 20-noded brick part (ANSYS manual four.2). Again, pile and pile cap were discretized 2-dimensionally by four noded plane forty two solid parts, that were extruded with 20-noded brick part.
The boundary conditions were thought of as a correct restrain on the mesh. The nodes happiness to the fringe of the mesh were mounted against displacement in each horizontal directions; nevertheless stay liberated to have displacement vertically. The nodes constituting very cheap of the mesh were mounted against displacement in each horizontal and vertical directions as shown in Fig. 2
The boundary conditions were thought of as a correct restrain on the mesh. The nodes happiness to the fringe of the mesh were mounted against displacement in each horizontal directions; nevertheless stay liberated to have displacement vertically. The nodes constituting very cheap of the mesh were mounted against displacement in each horizontal and vertical directions as shown in Fig. 2

Two varieties of material were thought of within the pile-soil model. The property of concrete was appointed for the pile, whereas soil properties (Clay) were appointed for the soil. the main points of the various properties got in Table 1.

Case 1: lateral load capability of 1x2 pile cluster below variable length and glued diameter.
Case 2: Lateral load capability of 1x2 pile cluster below mounted length and ranging diameter.
Case 3: impact of pile cluster configuration on lateral load capability.
Here, the pile length (L) and diameter (D) square measure chosen in such the way that the L/D magnitude relation remains same for each Case one and Case a pair of. every of the higher than mentioned case has been mentioned severally below.
The arrangement of the pile for this case is shown in Fig. a pair of with detail specification as mentioned in Table a pair of. it absolutely was discovered from Fig. three that lateral load carrying capability remains virtually same with increase long of pile within the pile cluster. Again, for all the 3 lengths of the pile (6.0m, 8.0m and 12.0m), the lateral load carrying capability will increase with increase in spacing between the piles. this can be owing to the very fact that because the spacing will increase step by step, the overlap of stress zone of of the individual pile within the cluster decreases, which ends in a rise in load carrying capability of the pile cluster.
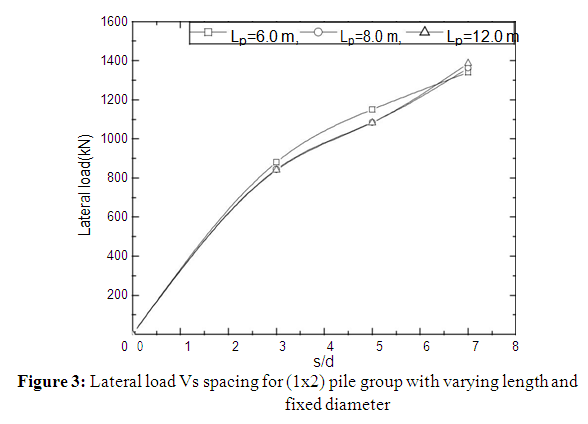
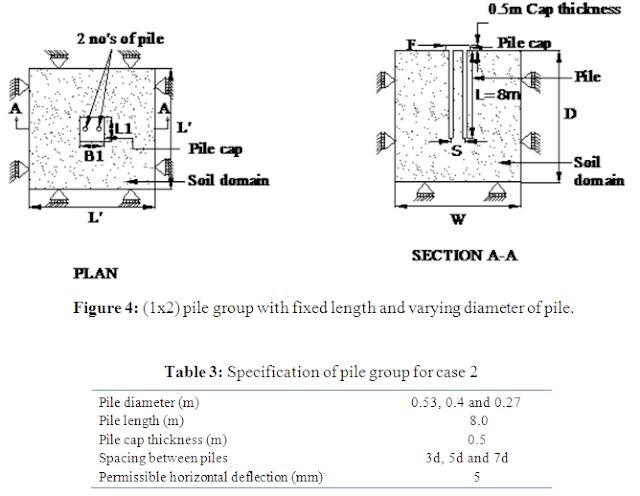
Fig. 4 shows the arrangement of the piles within the cluster for the second case. The specifications square measure listed in Table three below and therefore the results obtained square measure shown in Fig. 5. during this case, the lateral load carrying capability of the pile cluster will increase significantly with the rise in diameter of the piles. because the diameter will increase, the expanse of the piles will increase which supplies additional resistance to the lateral load.
 Based on the results of Case one & Case a pair of, it are often finished that increasing L/D magnitude relation merely didn't increase the the load carrying capability. It depends on the diameter of the piles that is that the main think about increasing the lateral load carrying capability.

The impact of pile cluster configuration was studied by considering 1x2, 2x2 and 1x3 pile teams as shown in Fig. 1, half-dozen and seven severally. The specifications square measure listed in Table 4.


 Horizontal masses square measure applied at the highest as shown within the figure and therefore the results were premeditated in Fig. 8. it absolutely was found that in an exceedingly pile cluster the direct action depends on the orientation of the piles within the cluster. during this case, each 1x3 and 2x2 pile cluster has identical numbers of pile i.e. 4, however the resistance of the 1x3 pile cluster became over the 2x2 pile cluster. this can be owing to the rise within the volume of soil between the piles in 1x3 than in 2x2 pile cluster that will increase the direct action of the group.
Based on the results of this study, the subsequent conclusions are often created associated with the influence of horizontal load on lateral response of a pile cluster.

RESULTS AND DISCUSSION
Though there square measure several factors that have an effect on the response of the pile behavior, solely 3 major factors were thought of during this study. These square measure divided into 3 cases as mentioned below.Case 1: lateral load capability of 1x2 pile cluster below variable length and glued diameter.
Case 2: Lateral load capability of 1x2 pile cluster below mounted length and ranging diameter.
Case 3: impact of pile cluster configuration on lateral load capability.
Here, the pile length (L) and diameter (D) square measure chosen in such the way that the L/D magnitude relation remains same for each Case one and Case a pair of. every of the higher than mentioned case has been mentioned severally below.
Case 1: lateral load capability of 1x2 pile cluster below variable length and glued diameter.

Case 2: Lateral load capability of 1x2 pile cluster - Length mounted and diameter variable


Case 3: impact of pile cluster configuration on lateral load capability


CONCLUSIONS
Based on the results of this study, the subsequent conclusions are often created associated with the influence of horizontal load on lateral response of a pile cluster.
- The increase in L/D magnitude relation of pile didn't offer any increase in lateral load capability of pile cluster if the diameter is unbroken constant and length changes.
- The lateral load carrying capability of a pile cluster will increase with the rise in diameter of the piles.
- The lateral load carrying capability of a pile cluster will increase with the rise in spacing between the piles.
- The direct action offered by a pile cluster depends on the orientation of the piles within the cluster. once the quantity of soil between the piles will increase, the resistance of the pile cluster againstthe lateral load additionally will increase.
REFERENCES
- Phanikanth V S, Choudhury D, Reddy C R. “Response of Single Pile under Lateral Loads in Cohesionless Soils” [J]. Electronic Journal of Geotechnical Engineering, 2010(15): 813-830.
- Zhao M H, Liu D P, Zhang L, Jiang C. “3D Finite Element Analysis on Pile-Soil Interaction of Passive Pile Group” [J]. Cent. South Univ. Technol., 2008(1): 75−80.
- Poulos H G, Davis E H. “Pile Foundation Analysis and Design”. John Wiley & Sons, New York, 1980.
- Feng C, Sanshan C, Guoping, J. “Response Characteristics of Pile Foundation under Coupled Loads” [J]. Electronic Journal of Geotechnical Engineering, 2014(19): 10419-10428
- Zadeh N G, Kalantari B. “Performance of Single Pile under Vertical and Lateral Load in Sand, Clay and Layered Soil” [J]. Electronic Journal of Geotechnical Engineering, 2011(16): 1131-1146.
- Karthigeyan S, Ramakrishna V V G S T, Rajagopal K. “Influence of Vertical Load on the Lateral Response of Piles in Sand” [J]. Computers and Geotechnics, 2006(33): 121–131.
- Wu D, Brooms B B, Choa V. “Design of Laterally Loaded Piles in Cohesive Soils Using p-y Curves” [J]. Soils and Foundations, 1998, 38(2): 17-26.
- Brown D A, Shie C F. “Three Dimensional Finite Element Model of Laterally Loaded Pile” [J]. Computers and Geotechnics, 1990(10): 59–79.
- Mostafa Y E. “Design Considerations for Pile Groups Supporting Marine Structures with Respect to Scour” [J]. Scientific research, 2012(4): 833-842.
- Basack S, Bhattacharya A K. “Influence of Lateral Cyclic Load on Pile Foundation with Emphasis on Disturbance at Ground Surface” [J]. Electronic Journal of Geotechnical Engineering, 2009(14): 1-11
- Bouzid D A, Bhattacharya S, Dash S R. “Winkler Springs (p-y curves) for Pile Design from Stress-Strain of Soils: FE Assessment of Scaling Coefficients using the Mobilized Strength Design Concept” [J]. Geomechanics and Engineering, 2013(5): 379-399.
- Abbas J M, Chik Z, Taha M R. “Influence of Group Configuration on the Lateral Pile Group Response Subjected to Lateral Load” [J]. Electronic Journal of Geotechnical Engineering, 2010(15): 761-772.
Resistivity Laboratory Measurement of Geomaterial
Resistivity Laboratory Measurement of Geomaterial
Haryati Awang
Institute for Infrastructure Engineering and Sustainable Management, Faculty of Civil Engineering, Universiti Teknologi MARA, 40450 Selangor, Malaysia e-mail: harya406@salam.uitm.edu.my
Cho Gye-Chun
Professor
Department of Civil and Environmental Engineering, KAIST, Daejon, Korea
e-mail: gyechun@kaist.ac.kr
ABSTRACT
Haryati Awang
Institute for Infrastructure Engineering and Sustainable Management, Faculty of Civil Engineering, Universiti Teknologi MARA, 40450 Selangor, Malaysia e-mail: harya406@salam.uitm.edu.my
Cho Gye-Chun
Professor
Department of Civil and Environmental Engineering, KAIST, Daejon, Korea
e-mail: gyechun@kaist.ac.kr
ABSTRACT
INTRODUCTION
Field technique of electrical electrical resistance is currently ordinarily utilized in web site investigation to get the knowledge of the subterranean together with the profiles and therefore the geo-material index. Realizing that the electrical electrical resistance technique within the gift development doesn't offer direct quantitative knowledge on engineering parameters besides the interpretation of the subterranean image need high personnel talent, there's a desire to full fill the void during this issue. moreover, so far there's no important electrical electrical resistance index for geo-material particularly for tropically worn rock and so it's positively laborious to interpret the electrical electrical resistance result from this region. this application on electrical electrical resistance is a smaller amount appreciated by technical personnel significantly civil engineers with the rationale that the info provided, is hollow to engineering work. Thus, the technique is a smaller amount considerable to be used in engineering science works. For these reasons this analysis was distributed to develop a non-destructive take a look at in laboratory exploitation electrical electrical resistance thought that is termed as geo-resistivity technique.
The geo-resistivity could be a technique wherever current is applied to the bottom samples and totally different in its potential produces geo-resistivity values. This study was distributed as Associate in Nursing improvement study of electrical electrical resistance technique that's popularly utilized in field mensuration.
MATERIALS And METHODS
Materials
Two varieties of material, mineral (artificial rock) and arenaceous rock (real rock) were utilized in this study as shown in Fig. 1. For the aim of frequency configuration, artificial rocks were ready exploitation mineral powder and water. The mineral powder of 1000g mixed with 650 cc of water in PVC tube to make sculptural cylindrical form kind of like cored sample of rock with dimension of fifty metric linear unit diameter. For real rock samples variety of arenaceous rock were collected from a web site at Puncak Alam and Bukit Kerayong of Selangor state, Malaysia. Some blasting and excavation activities from the sites offer samples for laboratory analysis for many weathering grades. to get cylindrical form samples, the blocks were cored to NX core size. each mineral and sandstones were ready in fifty metric linear unit diameter (D) cored samples and therefore the thicknesses or length (H) ranging from 20 mm to 115 mm.

Experimental Set-up
An important equipment of electrical electrical resistance mensuration device within the laboratory, a resistance meter, LCR meter model LCR-821, with frequency vary from twelve cycle to one thousand kc was utilized in this study as shown in Fig. 2. The LCR meter was functioning as electrical resistance instrument to live the resistance of a fabric once current is applied between each ends of the fabric. Power offer for the LCR meter was sourced from AC current of 240 V. This meter was connected with two wires (provided) of radial and axial leaded parts. The sizes of the sample depend upon the target of the damaging take a look at once the electrical resistance take a look at. different equipment is sample holder that fictional with rotation gear and clamping devices. The clamping pressure is constant by the cell pressure that was put in at one finish of the holder. Electrical electrical resistance mensuration were performed with 2 wires from four terminals (connected to check fixtures) were connected to the 2 current electrodes. To measure the resistance of the sample, the LCR meter was turned to R/C mode. By connecting the 2 ends of the cables to 2 current electrodes at the each ends of the sample, resistances reading were recorded.

Instrument Self-Calibration
Calibration on the resistance meter (LCR) was distributed before conducting resistance mensuration on the sample because it is vital a part of the take a look at technique. the aim of standardisation is to urge the correct and consistence reading of the tested material. In actual electrical resistance mensuration, Associate in Nursing extension of the mensuration port with cables or take a look at fixture was connected. For standardisation purpose open and short zeroing method should be done as in Fig. 3. Zeroing is one in every of the self-calibrations before running the take a look at. so as to eliminate strayed electrical resistance of take a look at cable and take a look at fixtures throughout the mensuration, the four (4) take a look at cables/ fixture error should be corrected before any mensuration is distributed. The corrections ar calculated and hold on in memory of the LCR Meters throughout the zeroing method. once passing the zeroing method, (if the zeroing method is palmy, a message of ‘OK’ can seem in LCR meter. If failing a message of “ FAIL” can appear) the mensuration can show ‘zero’ (~0) once tested on ‘short test’.
Frequency Configuration Test
To measure the resistance of a solid or liquid material, it needs configuring the frequency as a result of each material has it own frequency. the aim of frequency configuration is to pick out the perfect frequency of rock material for resistance mensuration. a continuing resistance reading are going to be created at a particular frequency vary that is termed as frequency configuration. Associate in Nursing electrical resistance mensuration of a fabric {in a|during a|in Associate in Nursing exceedingly|in a very} circuit of Associate in Nursing AC at a given frequency is outlined by an

impedance vector consists of a true half (resistance, R) Associate in Nursingd an pure imaginary number (reactance, X) or in polar type as a magnitude, |Z| and phase, θ and mathematically it is expressed as

The cable and text fixture should be zeroed at every time the frequency and material is modified. to make sure the accuracy of the cable and take a look at fixtures, mensuration was created by connecting each cables. Results of R = -0.0008 ohm (nearly zero) was shown. For frequency configuration, shaped mineral was wont to simulate the homogenized rock. The solid sample was tested for resistance mensuration and readings were recorded exploitation LCR meter.
RESULT AND DISCUSSIONS
Frequency Configuration
Graph in Figure three shows the frequency configuration of the solid mineral representing ground material. The resistance shows a stable response at the frequency between one hundred kc to one thousand kc as shown in Figure 3(a). The vary of import is suited to the high resistance material like rock. letter (θ) achieved nearly zero reading (θ~0) at five hundred kc that mean that the Z = R at that frequency Figure three (b). in the meantime the capacitance mensuration shows constants reading from one hundred kc to one thousand kc Figure 3(c).
The mensuration for the mineral or land material ought to be performed at the frequency of five hundred kc as a result of at this frequency it offers a perfect resistance, R. This frequency are going to be set for any mensuration for solid material like rock because it showed a continuing reading. This configuration explains that in any material that beneath choose a resistance take a look at exploitation the higher than aforementioned LCR meter at five hundred kc frequency, the result provides a true resistance worth of the material.

Geometric impact

CONCLUSIONS
REFERENCES
- Antoine, M. M. and J. M. Bradford (1982) “Parameters for Describing Soil Detachment due to Single-Water Impact,” Sad Sam Soc. Am. J., 46, 36-840.
- Awang, H., Nawawi, M.N., Mohammed, Z (2006) “A laboratory study on the influence of dc and ac current on electrical resistivity index of geo-materials” National Seminar on Civil Engineering Research. 19-20 December 2006. Johor Bharu.
- Muhammad Syukri, Dr. Rosli Saad, Dr. M.M. Nordiana, and I. N. Azwin: “Preliminary Study of Sumatera Fault Using 2-D Resistivity Imaging Method” Electronic Journal of Geotechnical Engineering.
- Abdoullah Namdar: “Tsunami and Liquefaction Resistance of Subsoil” Electronic Journal of Geotechnical Engineering, 2013.
- Muhammad Syukri, Dr. Rosli Saad, Dr. M.M. Nordiana, and I. N. Azwin: “Preliminary Study of Sumatera Fault Using 2-D Resistivity Imaging Method” Electronic Journal of Geotechnical Engineering, 2014.
Langganan:
Postingan (Atom)